(To play the video, please click on the image above)
Photo: Rift graben in the Krafla Rift Zone, a spreading zone visible on the Earth’s surface in Iceland, Krafla, Iceland, 2006 (photo: Meschede).
(To play the video, please click on the image above)
Photo: Rift graben in the Krafla Rift Zone, a spreading zone visible on the Earth’s surface in Iceland, Krafla, Iceland, 2006 (photo: Meschede).
The solid lithospheric plates move on the flowable asthenosphere. The North American plate, for example, is moving away from Europe as part of the Eurasian plate by 2 to 2 ½ cm per year. But which plate is actually moving where? It’s not easy to determine on a sphere. Is America moving west and Europe staying fixed, or is Europe moving east and America staying fixed, or are they both moving in different directions?
For the mathematical description of a movement we need a reference, an object moves from point A to point B or, to put it another way, you are standing at location A and an object is moving away from you to point B. This is also how we can describe plate movements. We need a reference point or reference system to describe plate movements. If we consider the example of movement between America and Europe, then America is moving away from Europe at a rate of just over 2 cm/year – in this case the European plate is the reference system: America is moving 2 cm westward relative to Europe. This describes the relative plate movement and a relative movement velocity between America and Europe. It works the other way around too: viewed from America, Europe moves 2 cm to the east. The result is the same in the end. In order to determine in which direction the plate movements take place on the sphere, we need a reference system that is independent of the lithospheric plates and, unlike the plates, remains stationary.

Fig. 3.6.1: Simplified illustration of a spreading center with the development from a narrow to a wide ocean. Case 1: The location of the spreading center remains stationary in global reference frame (Meschede, unpubl., 2022).
A simplified diagram of a spreading center with the development from a narrow to a wide ocean is shown in Figures 3.6.1 and 3.6.2. The spreading movement is always symmetrical because the oceanic crust is deposited equally on both sides. The illustration roughly corresponds to the situation between America and Europe over 100 million years ago, shortly after the opening of the Atlantic. The 2 cm gap that arises between the two plates every year is filled with new oceanic crust. 1 cm of it belongs to America, 1 cm to Europe. In case 1 (Fig. 3.6.1) it is assumed that the spreading zone is stationary. Here the gap remains in the middle while the two plates move away to the right and left.

Fig. 3.6.2: Simplified illustration of a spreading center with the development from a narrow to a wide ocean. Case 2: The right plate remains stationary, the spreading center shifts (Meschede, unpubl., 2022).
In case 2 (Fig. 3.6.2) the right plate is considered stationary. The result is that the spreading zone is displaced, with the left plate moving away from the right plate at double speed and the spreading center at single speed. The end result is the same as in Case 1, in that an equal amount of new oceanic crust was formed on both sides of the spreading center.
The main difference between the two models is that in the first case the spreading zone is considered stationary, while in the second case it changes position. This is particularly important with regard to the mantle flows in the flowable asthenosphere, because it is actually the case that the spreading zones are not stationary.
In order to be able to determine in which direction a plate is moving on the globe, you need a reference system that is independent of the individual plates. Hotspots are fixed points that remain stationary in relation to the globe over many millions of years. You can see this, for example, by the fact that the plates move over the hotspots. With their help we can determine the real plate movements on Earth; we then speak of the absolute plate movements in contrast to the relative ones, which always only refer to the movement between two plates.
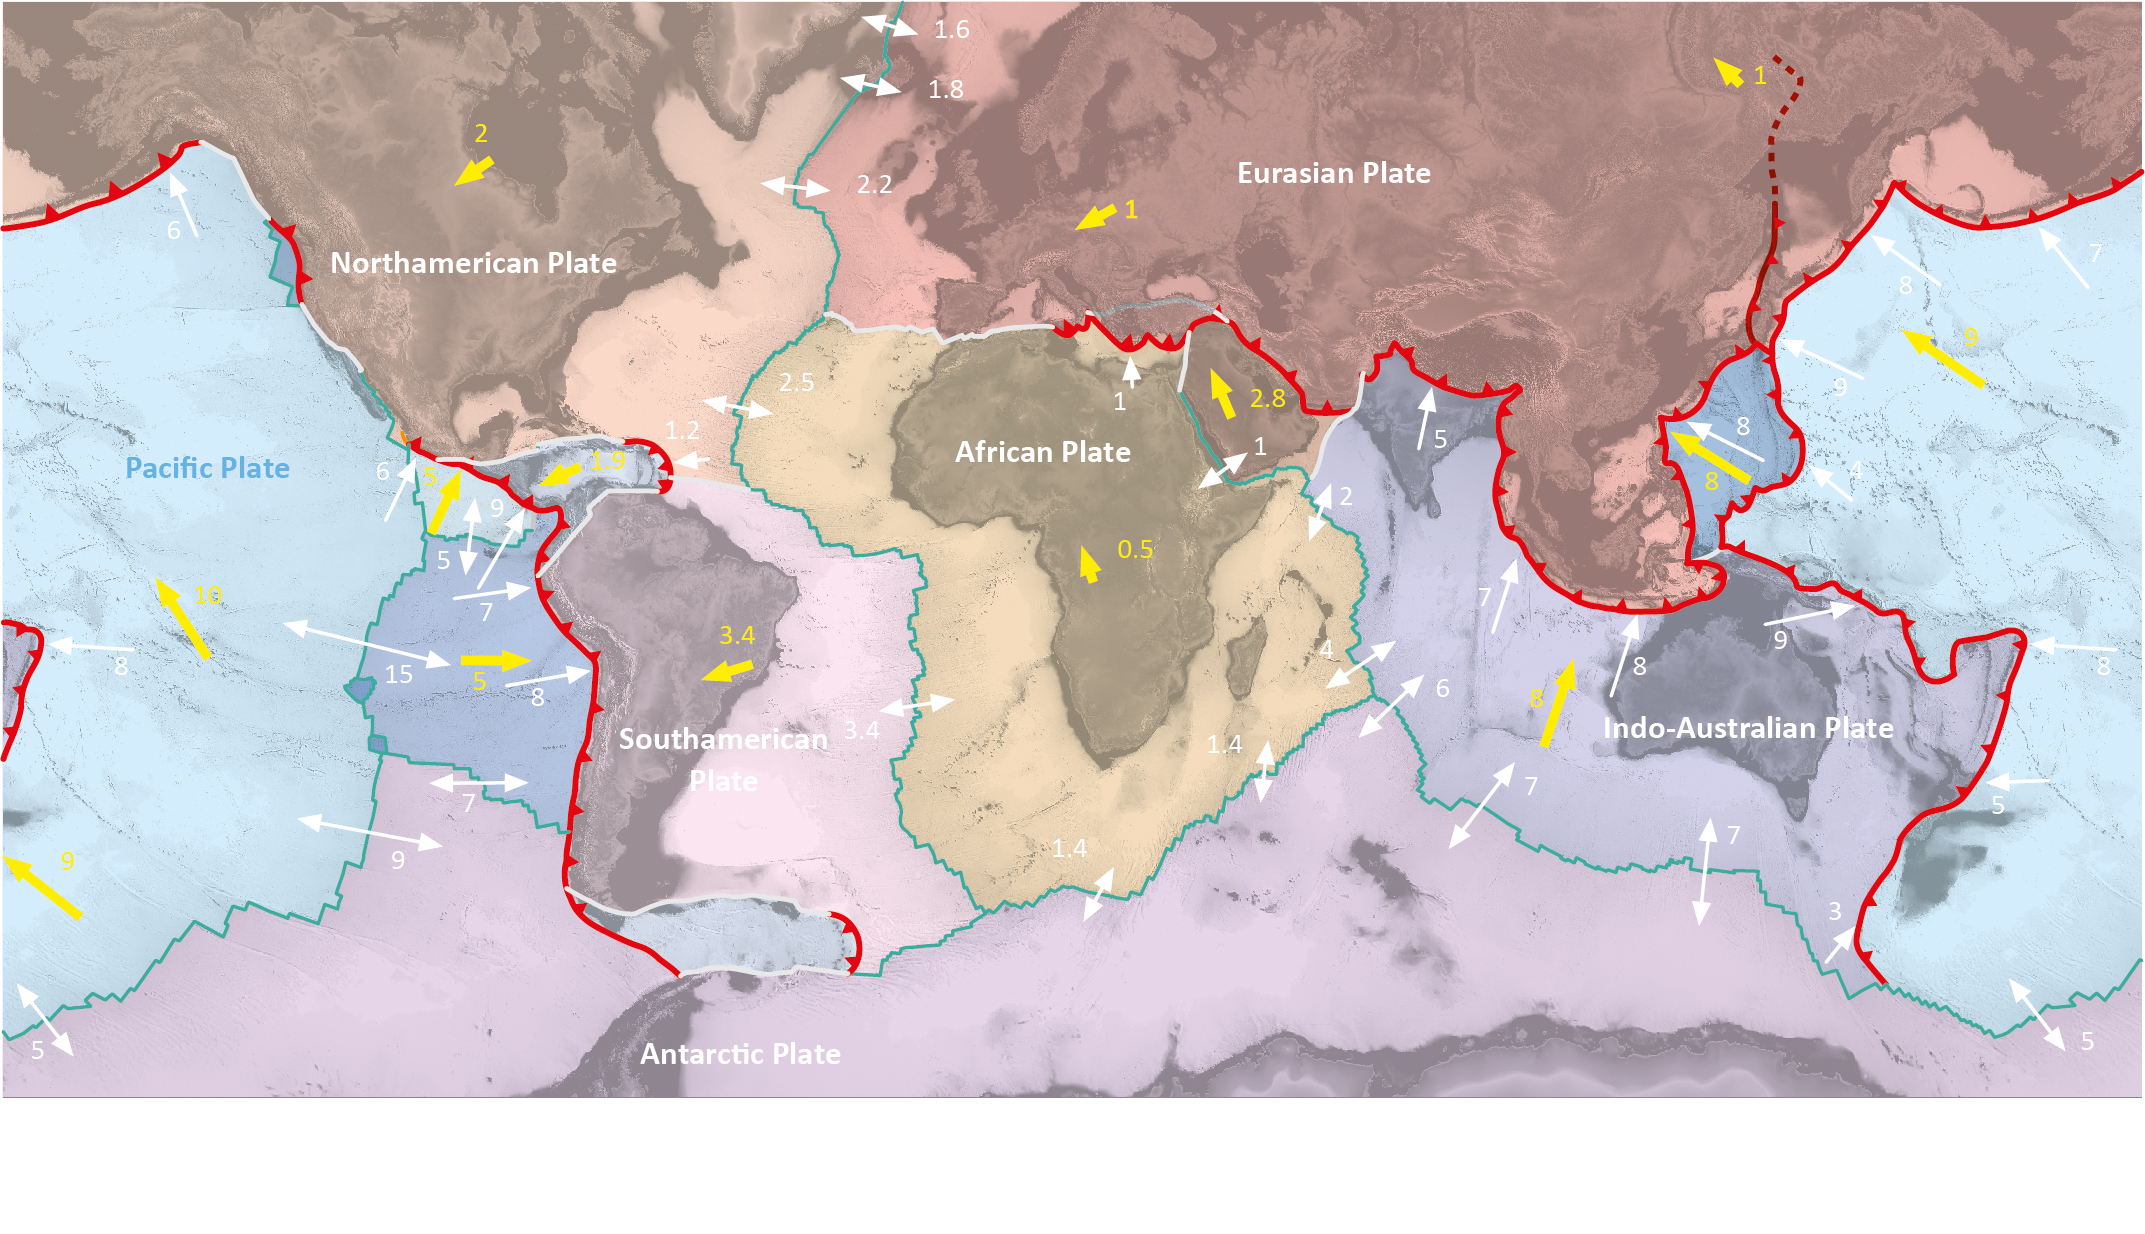
Fig. 3.6.3: Relative and absolute plate motion velocities (from Frisch & Meschede, 2021)
The map in Fig. 3.6.3 shows the relative plate movements with white arrows, for example the already mentioned 2 cm between Europe and North America or 3.4 cm between South America and Africa. Yellow arrows indicate the absolute plate movements, which apply to the plate as a whole and not just at the respective plate boundaries, as with relative plate movements. You can see that the relative movements of one and the same plate can be quite different, for example the Indo-Australian plate off Java is moving towards Eurasia at 8 cm per year, but at the Himalayas this is only 5 cm. This has to do with the spherical shape of the Earth and will be explained in more detail in a later chapter on the geometry of plate movements. Africa is moving very slowly to the north at around 0.5 cm per year, while South America is moving at a slightly higher speed of 3.4 cm to the west. The spreading speed in the middle of the Atlantic is approximately the same and there is a reason for this, because the African plate can be viewed as almost stationary, as in the schematic example in Fig. 3.6.2.
Fig. 3.6.4: Animated model for the opening of the South Atlantic with reference to the hotspot reference system. Africa is viewed as largely stationary, while South America is drifting west (Meschede, unpubl., 2022).
The example of the spreading between South America and Africa shows how the plates move away from each other. The South Atlantic opened a little over 110 million years ago and since then the South American plate has been drifting westward with respect to the hotspot reference system, i.e. this is the absolute plate movement (Fig. 3.6.4). The African plate remained almost stationary, drifting just a little north, but not west. This results in the continuously changing position of the spreading center, which in this case also shifts westward, but only half as fast as the westward drift of the South American plate.
Fig. 3.6.5: Lava lake in the Halema‘uma‘u crater, Kilauea, Hawai‘i, USA (USGS, 2016)
How such spreading zones work and how their position changes again and again can be observed beautifully in a model in an active lava lake. A time-lapse video taken in 2016 in Kilauea’s Halema’uma’u crater in Hawai’i is available on the United States Geological Survey USGS website. You can see the opening of red fissures from which liquid lava is emerging. It cools down on both sides and turns black, which is why it is so clearly visible. It can also be seen how the gaps, which can be used as a model for the spreading zones, shift. The hot material rises at the gaps, like at the mid-oceanic spreading zones, and it is very impressive to see how these gaps shift, they are not stationary and they move sometimes slower, sometimes faster, but they constantly change their position. Based on geological periods of many millions of years, one can imagine the shift of the mid-oceanic spreading zones.

Fig. 3.6.6: Lava lake in the Halema‘uma‘u crater Kilauea, Hawai‘i, USA, as a model for spreading zones over small-scale convection cells (photo: Ivan Vtorov, 2012, Wikipedia; sketch: Meschede, unpubl., 2022).
In a bubbling lava lake there are small convection cells beneath the cracks that keep breaking up in which the heat is transported upwards. The sketch in Fig. 3.6.6 shows the convection currents beneath the cooled and then solid lava blanket. The currents go downwards on the sides, as you can see in the video Fig. 3.6.5.
Spreading zones and plate movement


![]()
©2022 Deutsche Geologische Gesellschaft - Geologische Vereinigung
